secret_to_happiness
The Secret to Happiness?
A comprehensive investigation into the structural determinants of global happiness using multi-dimensional visual analytics and 13 years of development data (2011–2023). This project challenges traditional economic narratives that assume rising income directly increases well-being. Through rigorous data analysis and high-dimensional visualization, we investigate whether happiness is fundamentally constrained by economic thresholds, filtered by governance quality, and reshaped by human development stages.
Combining economic indicators, institutional measures, demographic variables, lifestyle factors, and well-being metrics across ~150 countries, this study reveals the deeper architecture of global happiness through evidence-based insights rather than intuition.
Core Hypotheses
We test three fundamental hypotheses about the nature of national well-being:
Hypothesis A: The “Glass Floor” of Wealth
A minimum economic threshold is non-negotiable for national happiness. Below certain GDP levels, cultural or social factors cannot compensate for material deprivation. The analysis tests whether genuinely “Happy Poor” nations exist or whether wealth establishes an unbreakable floor beneath which happiness cannot rise.
Finding: Confirmed — No country with structurally low GDP per capita sustains high happiness. The Glass Floor exists.
Hypothesis B: The “Governance Multiplier”
Once basic economic needs are met, governance quality becomes the dominant predictor of happiness. Corruption functions as a multiplier that amplifies or suppresses the returns of economic growth. Middle-income nations with weak governance remain trapped in moderate well-being despite rising incomes.
Finding: Confirmed — Middle-income countries exhibit divergent happiness outcomes based primarily on corruption levels, not income alone. Governance determines the slope of the wealth-happiness relationship.
Hypothesis C: The “Maslow Reversal”
The drivers of happiness fundamentally shift as nations develop. Low-income nations prioritize physiological and safety needs (health, food security, reduced mortality), whereas high-income nations encounter psychological and lifestyle challenges (isolation, declining fertility, diseases of despair, identity-driven aspirations).
Finding: Confirmed — Clear evidence of reversed need hierarchies. Happiness markers diverge completely between income tiers, reflecting different layers of Maslow’s hierarchy.
Dataset
Temporal Coverage: 2011–2023 (13 years)
Geographic Scope: ~150 countries across all regions
Core Data Files:
- HappinesssGlobalData_v6.csv — Primary analysis dataset
- df_30_countries.csv — Focused 30-country subset for detailed comparison
- Data Processing Methodology — Documentation on how raw datasets were ingested, reshaped, and merged.
Key Variables Analyzed:
- Economic: GDP per capita (PPP), household consumption, inflation, unemployment
- Institutional: Corruption index, political regime classification
- Social: Health expenditure, education spending, internet access, urbanization
- Demographic: Fertility rate, population, population growth
- Health/Lifestyle: Life expectancy, obesity, alcohol consumption, suicide rates
- Well-being: Happiness score, life satisfaction (Cantril Ladder)
Methodology
Data Preprocessing Pipeline
- Missing data handling: Forward/backward-filling within countries; targeted imputation for lagged variables
- Temporal normalization: Separated baseline years (2011–2019) from crisis years (2020–2023) to prevent temporal mismatches
- Outlier management: Manual review; retention when contextually plausible (e.g., hyperinflation episodes)
- Income tier segmentation: Classification by World Bank GDP (PPP) thresholds for comparative analysis
- Regional harmonization: Custom mapping to enable regional pattern analysis
Visual Analysis Framework
Rather than imposing strict statistical models on non-linear relationships, we prioritized high-dimensional visual analytics to reveal patterns, trajectories, and anomalies.
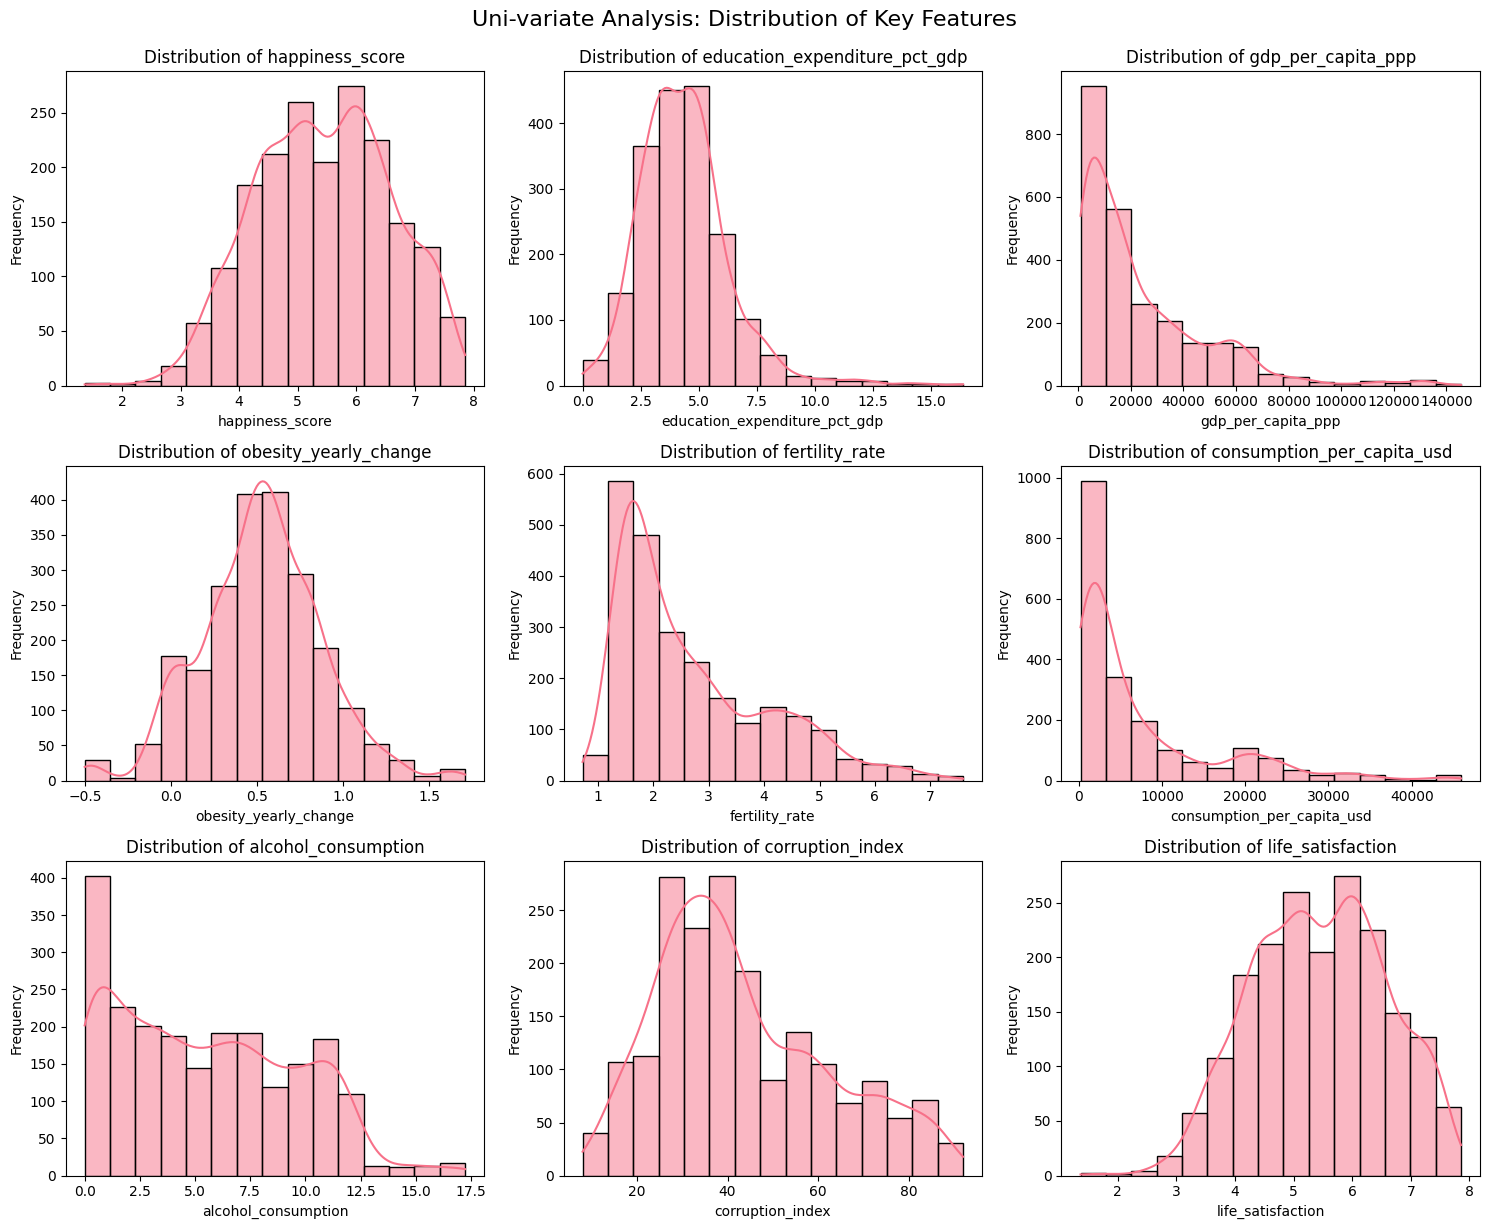
Univariate distribution of key economic, demographic, governance, lifestyle, and well-being indicators.
Major Findings & Insights
1. The “Iron Law of GDP”: Wealth as Foundation
- No high-happiness countries without substantial economic capacity
- A clear positive correlation between GDP per capita and national happiness
- Wealthy nations (>USD 40,000 per capita) consistently score 7.0+ on happiness
- Economic security forms the non-negotiable baseline for subjective well-being
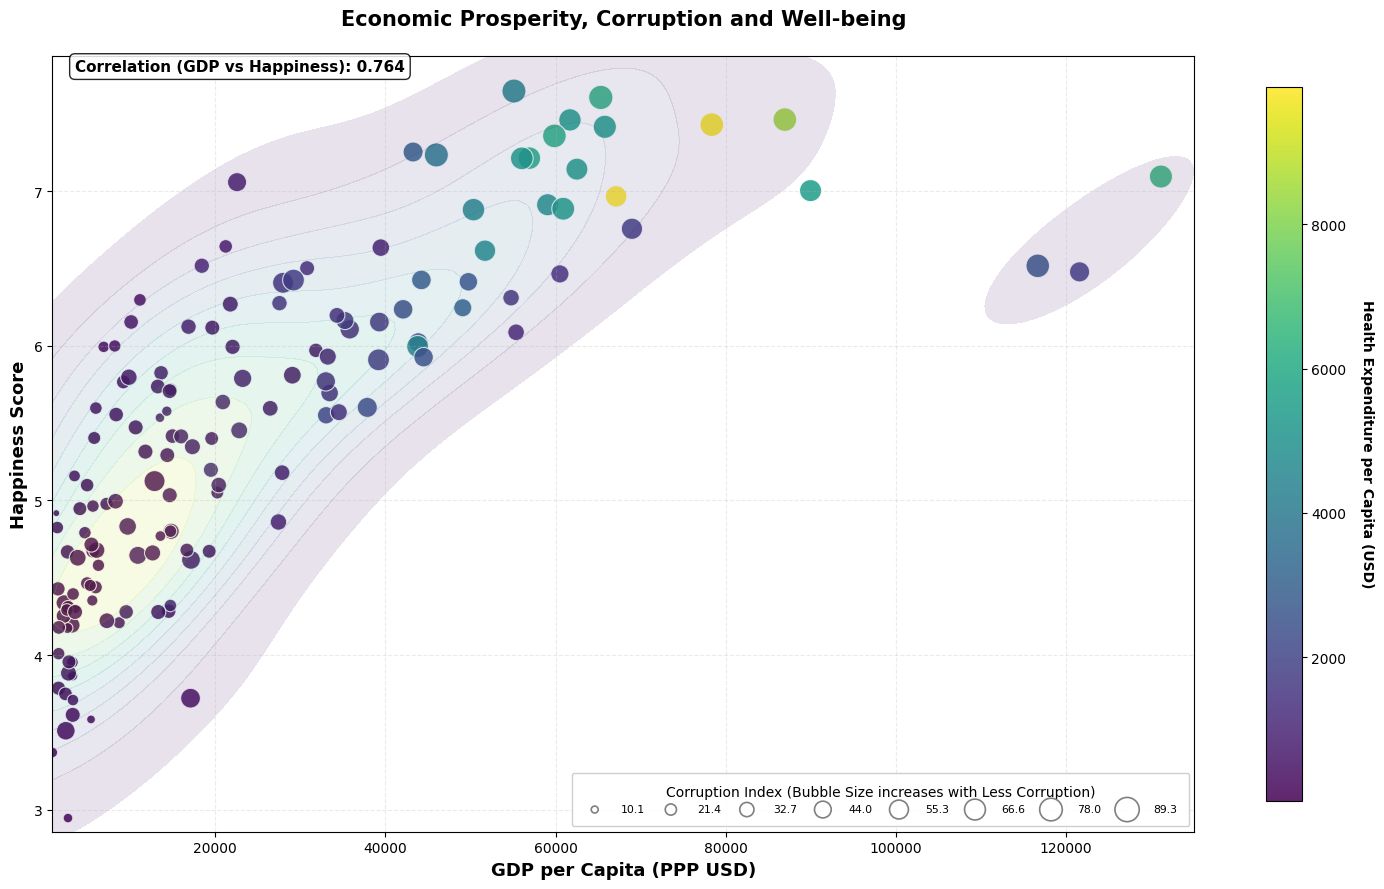
This visualisation illustrates how GDP per capita and happiness scores vary across countries, with bubble size indicating corruption levels and colour representing health expenditure per capita. The plot highlights how economic strength, healthcare investment, and institutional integrity collectively shape national well-being.
2. The “Governance Gradient”: The Corruption-Happiness Trap
- Once nations cross the middle-income threshold (~USD 10,000-40,000), governance quality becomes the primary differentiator
- Countries with high GDP but weak institutions remain stuck in the “Yellow Zone” (happiness 5.5–6.0)
- Clean, transparent institutions enable conversion of wealth into genuine life satisfaction
- Institutional failure causes rapid happiness collapse (sometimes within months), whereas economic recovery takes years
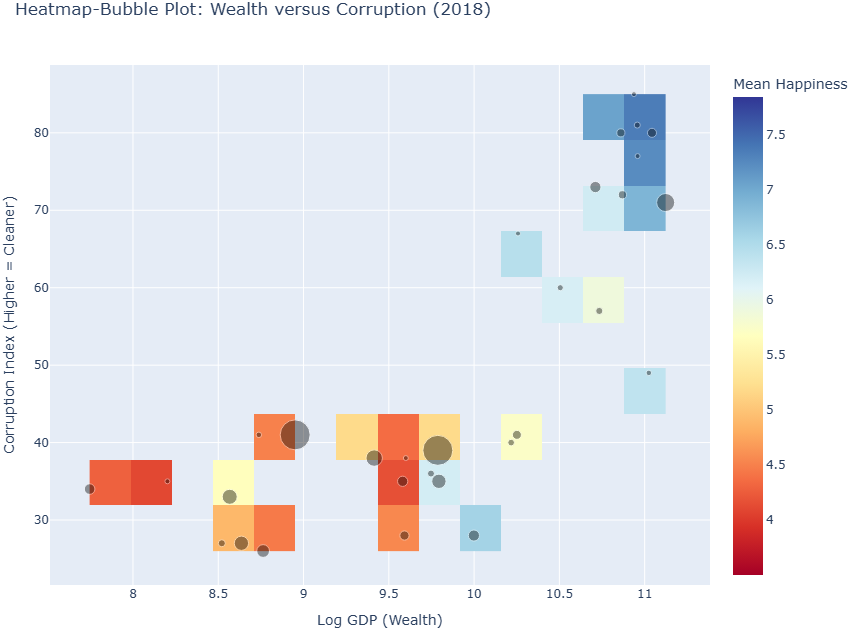
Heatmap–Bubble Plot Illustrating Global Patterns Between Wealth, Corruption, and Happiness (2018). Countries cluster tightly along a diagonal axis linking log GDP per capita to corruption index scores, revealing that economic development and institutional quality advance together. Bubble size reflects average happiness, showing that nations with rising wealth but stagnant governance remain trapped at moderate well-being levels, whereas those with both high prosperity and strong institutional integrity achieve the highest happiness scores.
3. The “Maslow Reversal”: Development Reshapes Human Needs
Low-Income Nations (Operating within Maslow’s lower tiers):
- High fertility rates (biological imperative under mortality risk)
- Minimal health expenditure (absent safety nets)
- Low obesity (scarcity, not dietary choice)
- Compressed, volatile happiness scores
High-Income Nations (Operating within Maslow’s upper tiers):
- Dramatically reduced fertility (lifestyle and identity choices dominate)
- Substantial health investment (institutionalized safety)
- Elevated obesity (conquest of scarcity creates new challenges)
- High, stable happiness (freedom from survival concerns)
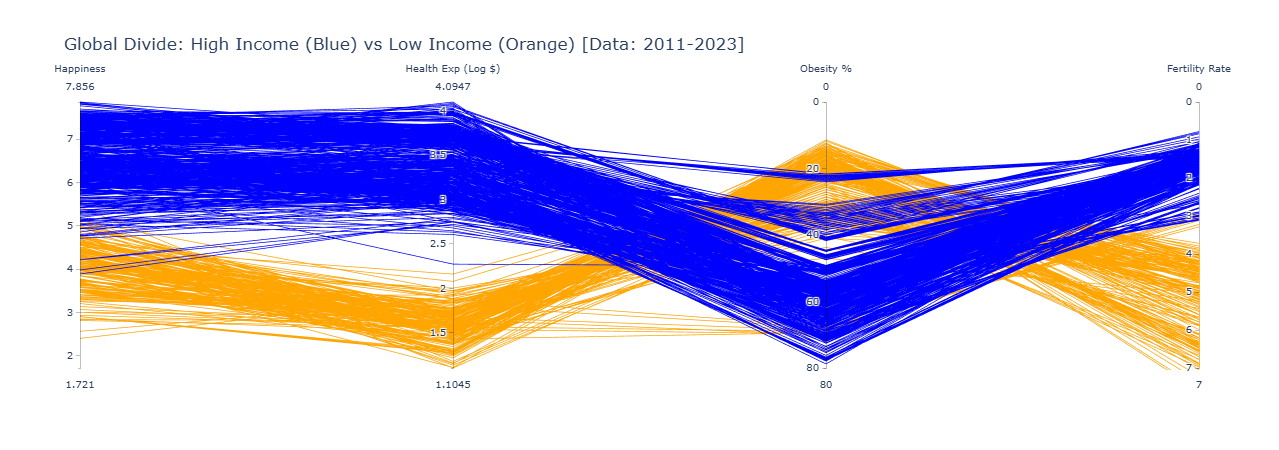
Maslow’s Hierarchy Divide Across Income Groups (2011–2023). Parallel–coordinates lines compare high-income countries (blue) and low-income countries (orange) across four core human-development indicators: happiness, health expenditure, obesity prevalence, and fertility rates. The contrasting trajectories illustrate the structural split in global development. High-income nations cluster at high happiness and health-investment levels but simultaneously exhibit very low fertility and high obesity, reflecting needs associated with the upper tiers of Maslow’s hierarchy. Low-income nations show the opposite pattern—lower happiness, minimal health expenditure, low obesity, and high fertility—indicating populations operating within the physiological and safety layers of the hierarchy rather than the self-actualisation layers reached by wealthier societies.
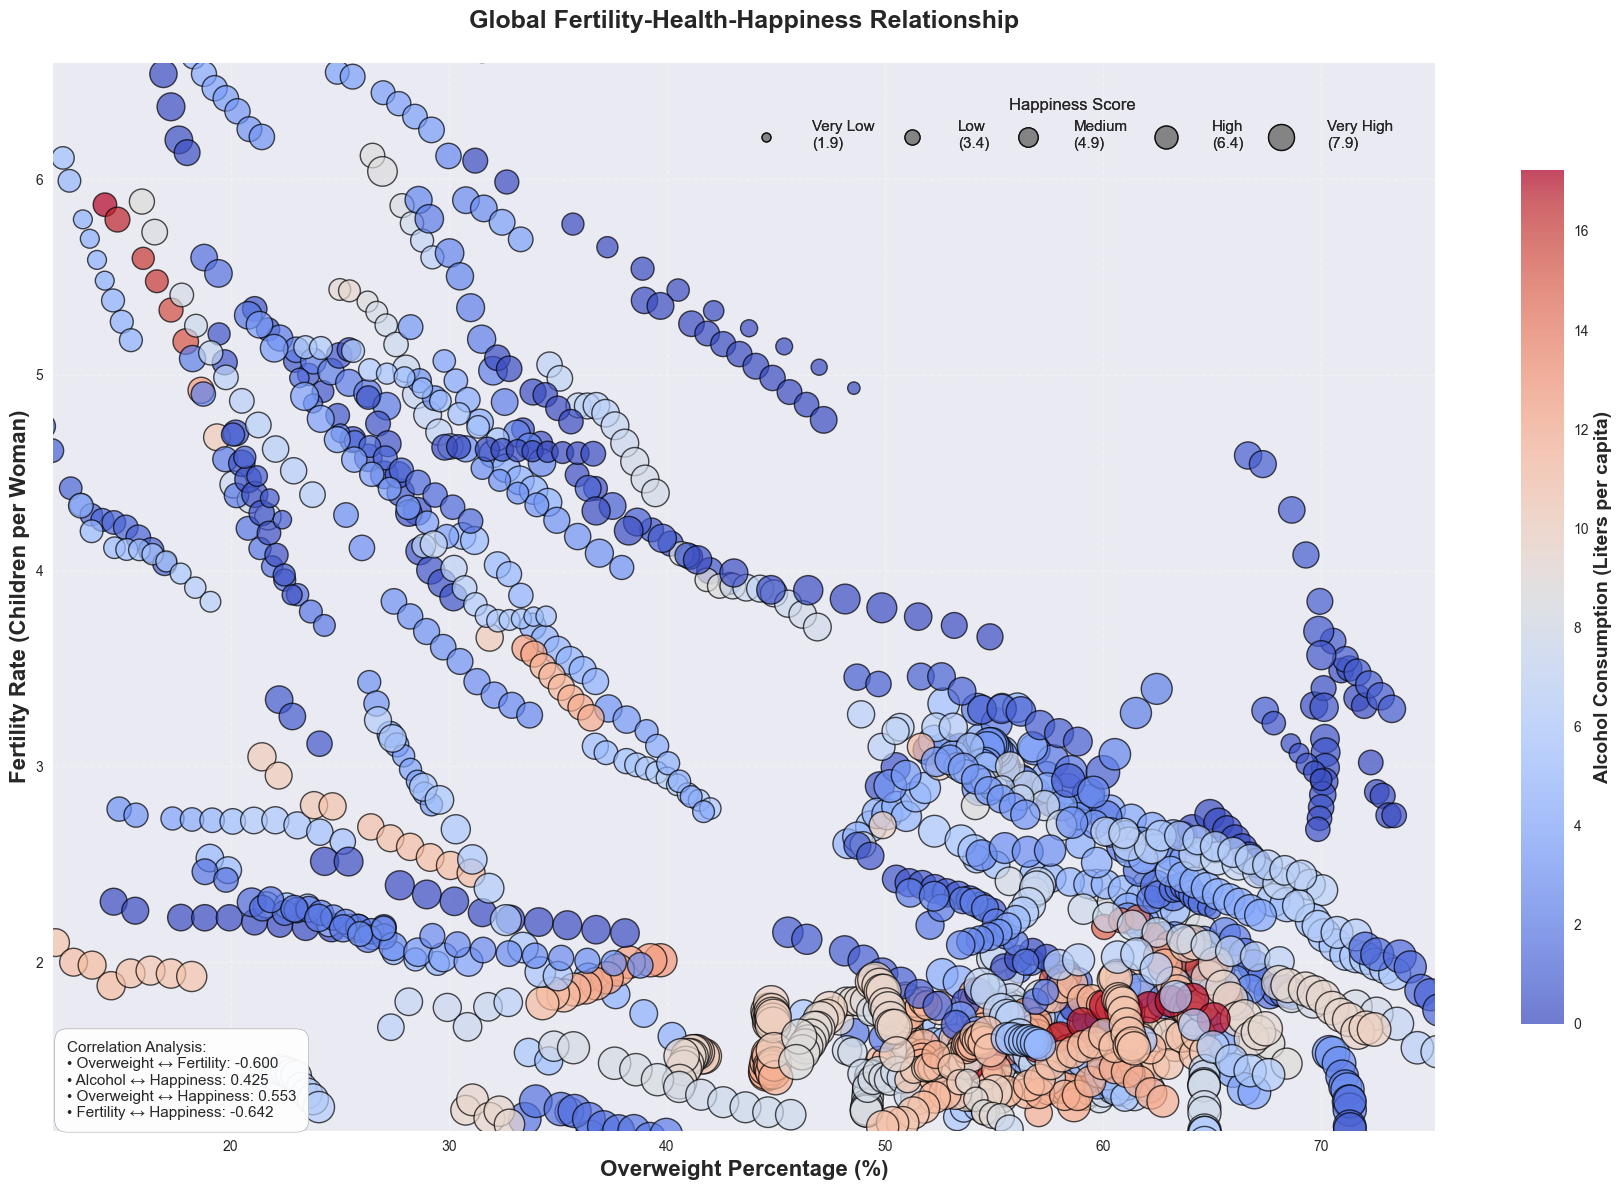
A bubble plot showing the relationship between overweight prevalence (%) and fertility rate (children per woman). Bubble size represents national happiness scores, while bubble colour indicates alcohol consumption per capita. The plot highlights how lifestyle factors, demographic patterns, and subjective well-being interact across countries.
4. The “Modernity Tax”: Hidden Costs of Development
- Societies that conquer material scarcity face new afflictions:
- Obesity & lifestyle diseases — from over-abundance rather than deprivation
- Suicide & mental health crises — emerging alongside prosperity
- Social isolation — despite (or because of) digital connectivity
- Modern well-being trade-offs cannot be explained by traditional poverty-reduction frameworks

Parallel-coordinates plot of social indicators and happiness levels in 2018. Lines coloured by happiness show that high-happiness countries cluster at high Internet Access and high institutional cleanliness, while simultaneously exhibiting higher suicide and obesity rates, highlighting the paradoxical social costs of modern development.

Parallel-coordinates plot of social indicators and happiness levels in 2022. Despite global social and psychological volatility, happier nations remain concentrated in regions of strong digital access and low corruption, while also continuing to show elevated suicide and obesity levels, illustrating the persistence of modernity-linked well-being trade-offs.
5. The “Green Zone Stability Effect”
- Countries with strong institutions (low corruption) show marked resilience to external shocks
- Even during severe crises (2008 financial crisis, 2020 pandemic), clean-governance nations maintained happiness
- Institutional trust acts as a shock absorber that economic wealth alone cannot provide
- Governance strength predicts resilience better than GDP strength

Parallel-coordinates plot of GDP, consumption, unemployment, inflation, and happiness in 2018. Lines coloured by happiness show that high-happiness countries cluster along consistently high GDP and consumption levels, with unemployment also aligning to this pattern, while inflation plays only a minor role.

Parallel-coordinates plot of GDP, consumption, unemployment, inflation, and happiness in 2022. Despite the global inflation surge, high-happiness countries remain concentrated in the upper GDP and consumption ranges, demonstrating resilience to price shocks, while lower-income nations exhibit the lowest happiness levels.
6. Regional Patterns
- Nordic region: Consistently high happiness (7.3–7.9 across entire period)
- Western Europe & North America: Stable, moderate-to-high happiness clusters
- Latin America: Moderate happiness despite economic challenges
- Sub-Saharan Africa & conflict zones: Lower, more volatile happiness trajectories
- Middle East & North Africa: Divergent outcomes; governance quality highly predictive
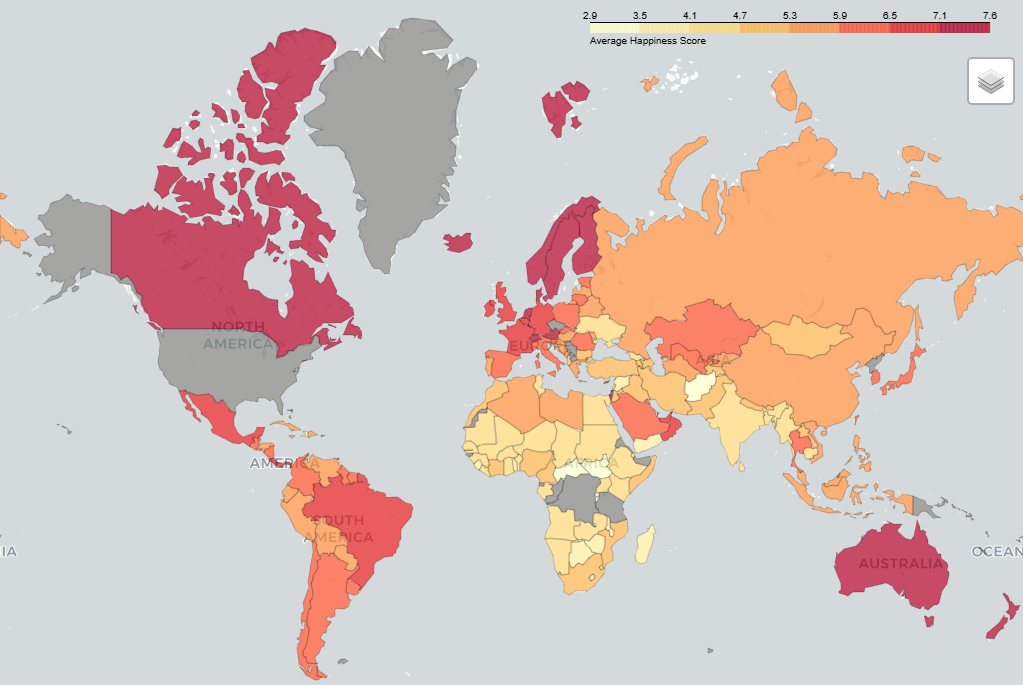
Global Happiness Distribution. Geographical representation of average happiness scores across nations, highlighting regional clustering and disparities. You can view the interactive map here.
Future Research Directions
- Dynamic Modelling: Quantify the speed at which shocks propagate through economic and social systems, building on the brittleness observed in temporal trajectories.
- Machine Learning Clustering: Apply clustering methods to refine the identification of structural “happiness archetypes”, enabling predictive classification of countries transitioning between Maslovian tiers.
- Interdisciplinary Integration: Combine with psychology, behavioural economics, and political science to deepen our understanding of how subjective well-being emerges from the interaction of material conditions, institutions, and societal values.
- Sub-national Analysis: Investigate within-country regional disparities and inequality effects as subsequent extensions to national-level models.
Research Team
- Ibrahim Hussain - ibrahimbeaconarion@gmail.com
- Izhan Nasir - izhan.nasir1@gmail.com
- Ali Asjad - asjadnaqvi1104@gmail.com